Total (all switches)
Traffic to all switches
Peak traffic
Daily graph, 5 minute average
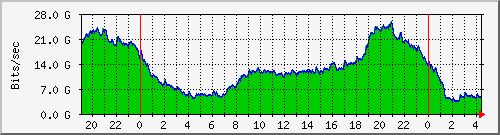
Max:
28.7 Gb/s (9.0%)
Average:
17.8 Gb/s (5.6%)
Current:
12.1 Gb/s (3.8%)
Weekly graph, 30 minute average
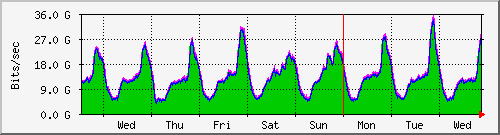
Max:
28.7 Gb/s (9.0%)
Average:
17.8 Gb/s (5.6%)
Current:
12.1 Gb/s (3.8%)
Monthly graph, 2 hour average
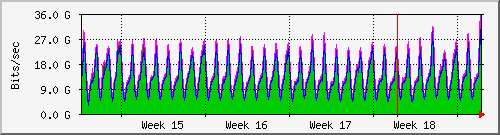
Max:
28.7 Gb/s (9.0%)
Average:
17.8 Gb/s (5.6%)
Current:
12.1 Gb/s (3.8%)
Yearly graph, 1 day average
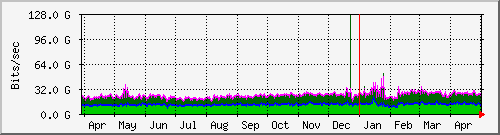
Max:
28.7 Gb/s (9.0%)
Average:
17.8 Gb/s (5.6%)
Current:
12.1 Gb/s (3.8%)